Every day at 2pm, our microservice crashed. Same traffic patterns, same infrastructure, same code - yet the database deadlocked and our SLA burned. Logs showed nothing. Metrics showed capacity. Something we couldn't see was destroying our system.
This is a story about unknown-unknowns: the failures you can't predict because you can't observe them. Join us as we retrace how OpenTelemetry exposed what our existing tools hid, guided by the principles of observability (or "O11y" as we'll affectionately call it).
We'll explore:
Leave knowing exactly where to start instrumenting your own services—and why you should, before 2pm strikes your system.
This talk is designed for Python developers who have relied on logs and metrics for production debugging but haven’t yet adopted distributed tracing, as well as SREs who appreciate a good production war story. No prerequisites are required, basic familiarity with Python, HTTP services, and databases is helpful but not required.
The session uses a narrative mystery format: a microservice that crashes daily at 2pm despite appearing healthy through traditional monitoring. Through a live dashboard of metrics, a “real” on-call alert, and real-time tracing data, you’ll see how OpenTelemetry tracing solved the mystery. The talk includes staged architecture diagrams, code walkthroughs of Python instrumentation, and live querying of genuinely generated trace data.
You’ll leave knowing exactly where to start with OpenTelemetry’s auto-instrumentation (and how to move into manual-instrumentation when you’re ready) in your own services, and with mental models for when tracing succeeds where logs and metrics fail.

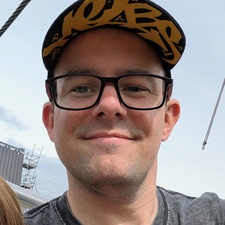
David (he/him) is a DevOops engineer long interested in abandoning intuition and “gut feel” for solid data to better answer “are my production systems healthy?” (spoilers: they probably aren’t) and help teams resolve the age-old mystery: “why does it do that in prod? it works on my machine!”